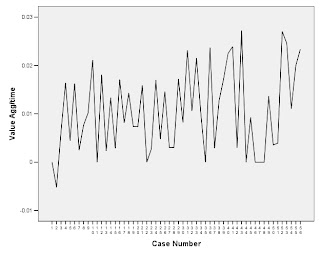
I have some graphic (as in graphs!) information on an Overbrook subject who did almost 60 trials over two days. You can see the changes in veering behavior with these two views. One (bottom) is just looking at the number of veering feedback prompts the student received. The (top graph) is a look at the number or no-veering minus veering prompts (adjusted for the time of the trial) which show another more subtle change in behavior. REMEMBER that according to Guth this student has had less than half the trials he applied before he noticed real change in his subjects.

I won't show it here, but our youngest and more cognitively involved subject showed some improvement in fewer veering prompts but with great variability in behavior throughout his three days of trials.
This looks very promising. We need to remember also that these trials were not tightly controlled, some variables in tolerance were adjusted over the days, and that more rigorous and study with more trials might yield much more significant results. Subjects (the small sample I looked at) do not seem to have consolidated or stabilized the straight-line behavior.
BTW, I looked at these subjects based solely on whether thaey veered at all when they began the trials (a few students did not) and whether we actually were able to conduct good testing with them; I did not select out the best (most iorived) subjects to look at because honestly I couldnt tell you who they would be.


No comments:
Post a Comment